The Interplay Between Mobile Interface Designs and Session Lengths in Gambling Applications
Felix Müller · Jun 4, 2026
The Interplay Between Mobile Interface Designs and Session Lengths in Gambling Applications
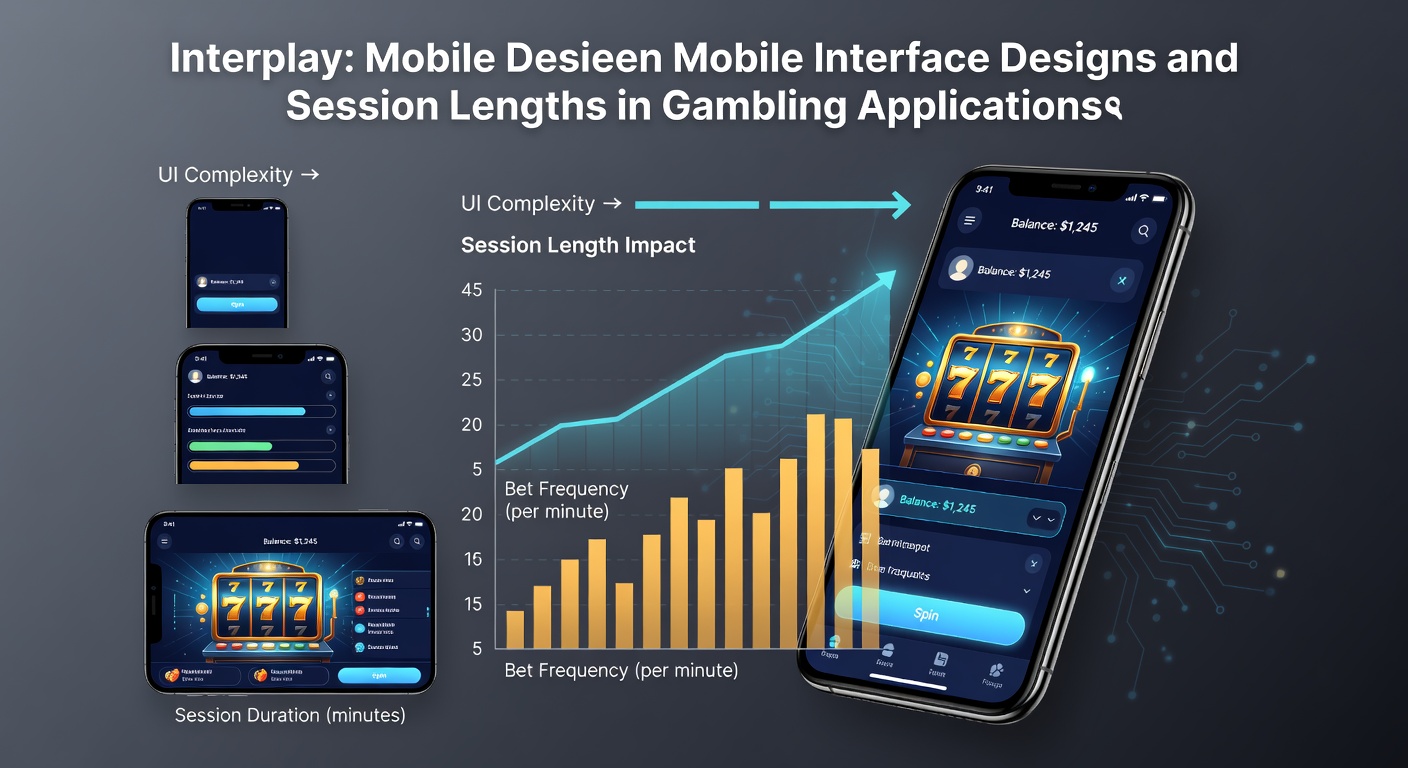
Mobile interface designs in gambling applications shape user engagement patterns through layout choices, touch response mechanisms, and visual feedback loops that directly influence how long sessions extend. Data from industry tracking shows average session durations ranging between 12 and 28 minutes depending on the specific combination of navigation menus, notification prompts, and reward display timing. Researchers at institutions focused on digital behavior have documented these connections across multiple platforms operating in regulated markets during 2025 and into mid-2026.
Core Design Elements That Affect Engagement Duration
Touch-friendly layouts with large tap targets and minimal scrolling requirements tend to keep users active longer, while cluttered screens with overlapping elements often lead to quicker exits. Swipe gestures for game selection replace traditional button grids in many applications, and this change correlates with extended play periods according to aggregated usage logs from operators in North American jurisdictions. Notification systems that appear at fixed intervals rather than random moments help maintain continuity, yet frequent pop-ups can interrupt flow and shorten overall time spent. Visual indicators such as progress bars for bonuses or real-time balance updates create feedback loops that encourage continued interaction without requiring users to leave the main screen.
Navigation Structures and Their Measurable Impact
Applications using bottom-tab navigation see different retention curves compared to those relying on hamburger menus or side drawers. Studies tracking user paths in Canadian provincial markets reveal that bottom-tab designs support sessions extending beyond 20 minutes at higher rates, while menu-hidden options lead to faster disengagement after initial game launches. Quick-access features like one-tap deposit buttons integrated near active game windows reduce friction points, and operators report these additions increase average session length by measurable percentages when deployed consistently across device types. Responsive design adjustments for varying screen sizes further stabilize engagement, since users on tablets versus phones encounter fewer interruptions from resizing issues.
Data Patterns Observed in Regulated Markets
Figures compiled through 2026 indicate that seamless loading transitions between games and lobby views extend participation windows, whereas delays exceeding three seconds prompt higher abandonment rates. The Alcohol and Gaming Commission of Ontario has compiled operator-submitted metrics showing correlations between interface speed optimizations and prolonged user activity across mobile channels. Progressive reward displays that update without page reloads maintain momentum, and applications incorporating these elements demonstrate steadier session curves in comparative analyses. Geographic variations appear as well, with markets in Australia recording longer average durations in apps that prioritize horizontal scrolling for slot libraries over vertical lists.
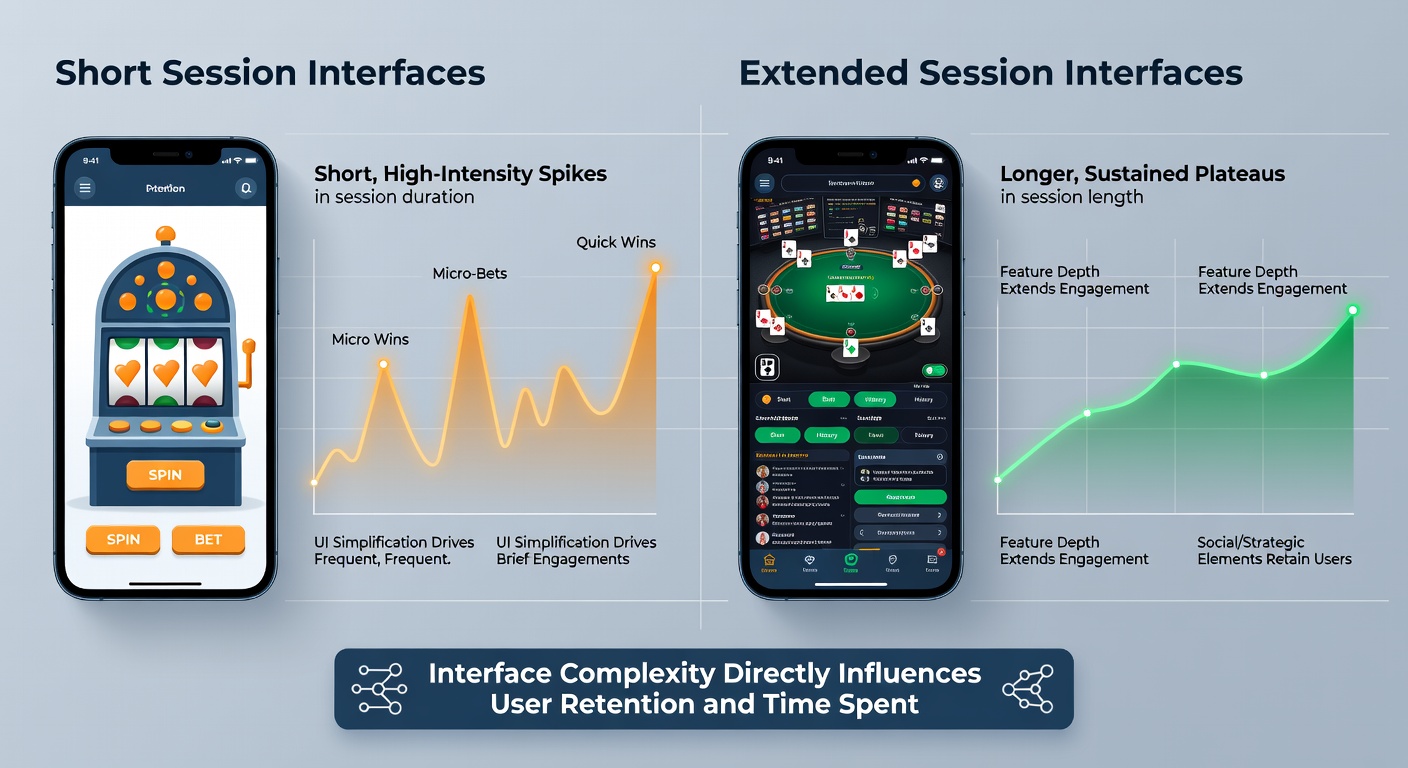
Heatmap data collected from user interactions highlights how thumb-reach zones on larger phone screens influence repeated taps on core controls. Areas positioned within natural grip ranges receive higher engagement density, and designers adjust placement accordingly to sustain activity. Color contrast choices adn animation subtlety also factor into these patterns, since overly bright or rapid movements can trigger quicker exits in some user groups.
Interface Testing Approaches and Session Metrics
Operators conduct A/B testing on specific components such as auto-spin toggles, balance visibility settings, and exit confirmation prompts to measure resulting changes in time-on-app. Results from these controlled variations show that simplified confirmation flows after deposits correlate with extended play windows, while added steps tend to fragment sessions into shorter bursts. The American Gaming Association has referenced aggregated findings from member companies indicating that mobile-specific optimizations rolled out in early 2026 produced noticeable shifts in duration distributions across participating platforms. Device compatibility checks ensure consistent performance on both iOS and Android ecosystems, preventing drop-offs caused by rendering inconsistencies.
Feedback Mechanisms and Continuity Features
Real-time chat integrations or community leaderboards embedded within the interface can extend sessions when they activate at natural breakpoints rather than during active spins. Push notification timing tied to user-defined preferences rather than default schedules shows stronger retention in longitudinal data sets. Applications that allow customization of interface density, such as adjustable card sizes or font scaling, accommodate diverse user preferences and support steadier engagement across different demographics. These adjustments appear in reports from multiple operators without relying on single-market observations.
Trends Emerging in June 2026
Recent updates in several applications have introduced adaptive interfaces that modify element spacing based on detected usage speed, and early logs suggest these features stabilize session lengths during peak evening hours. Cross-device continuity tools that sync progress between phones and tablets reduce re-entry friction, leading to cumulative time increases tracked in operator dashboards. Regulatory updates in various regions have prompted clearer disclosure elements within interfaces, and these additions integrate without disrupting established flow patterns when placed in peripheral screen areas.
Conclusion
Interface design choices in gambling applications connect directly to session length outcomes through measurable navigation, feedback, and responsiveness factors. Patterns documented across regulated markets demonstrate consistent relationships between specific layout decisions and duration metrics, with ongoing refinements continuing into 2026. Observers tracking these developments note that data-driven adjustments remain central to how platforms manage engagement across mobile environments.